The CO2 Impact of the 2020s’ Battery Quality Lithium Hydroxide Supply Chain
Alex Grant, Principal, Jade Cove Partners, San Francisco, USA
David Deak, President, Marbex, Palo Alto, USA
Robert Pell, President, Minviro, London, UK
January 2020
The PDF of this article is available here and its associated LinkedIn post is available here.
At the beginning of the 2010s, it was not yet clear that lithium-ion batteries (LIBs) were a good technology option for electrified road transportation. Electric vehicles (EVs) had low range, were historically unsexy, and there was no significant charging network built out anywhere in the world. At the beginning of the 2020s, the story is quite different. At time of writing, Tesla is the most valuable car company in American history, Benchmark Mineral Intelligence is tracking over 100 LIB “megafactories”, and European auto manufacturers have announced over 100 new EV models to enter the market in the next decade as the European Union is anticipated to phase out the sale of new internal combustion engine (ICE) vehicles. What a difference a decade makes!
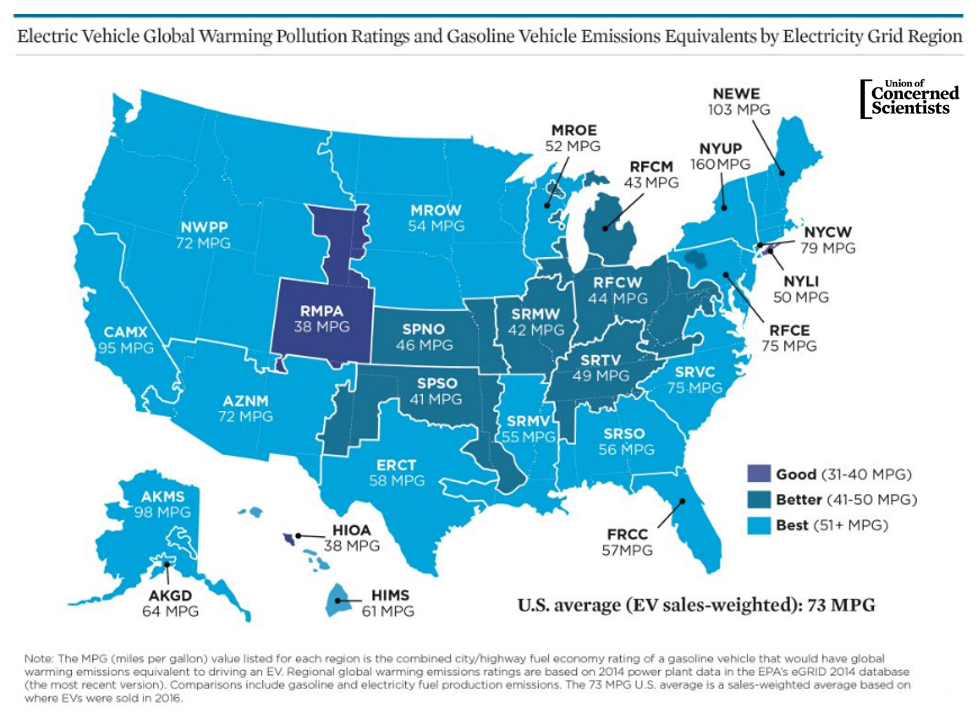
Battery and EV manufacturing has become so efficient that even with the current electricity grid relying on natural gas and coal, >70% of Americans can emit less CO2 by driving an EV than driving an ICE vehicle with 50 MPG fuel efficiency (highly efficient) according to the Union of Concerned Scientists. (1) As the grid moves away from fossil fuels and towards low carbon power sources like hydroelectric, solar, wind, nuclear, and geothermal, the CO2 emissions of making and driving an EV over its lifetime will become orders of magnitude less than driving the most efficient ICE vehicles available. These developments have led to a broad consensus that LIB-powered EVs are a feasible pathway to decarbonizing road transportation.
However, realizing full life cycle decarbonization will not be easy.
The fossil fuel industry and auto manufacturers, with decades of momentum and expertise in ICE technology, are incentivized to slow this transition so they can continue capitalizing on fossil fuel economy assets and have more time to catch up to Tesla and other advanced EV manufacturers. One theme that often gets discussed as a counter-argument to EVs is the concept of “embodied emissions”. Volkswagen estimates that they currently emit ~2.5x more CO2 to manufacture an EV compared to manufacturing an ICE vehicle because of the higher CO2 intensity of manufacturing LIBs and the raw battery materials that go into them. (2)
Those trying to discredit EVs use information like this to argue that they are dirtier than ICE vehicles, but that’s veritable fake news since over the lifetime of the vehicle, EVs cause far lower CO2 emissions than ICE vehicles on most developed nations’ grids. An EV charged by higher CO2 intensity power sources will still have a smaller CO2 footprint compared to an ICE vehicle; it will just take more miles driven to reach “carbon parity”.
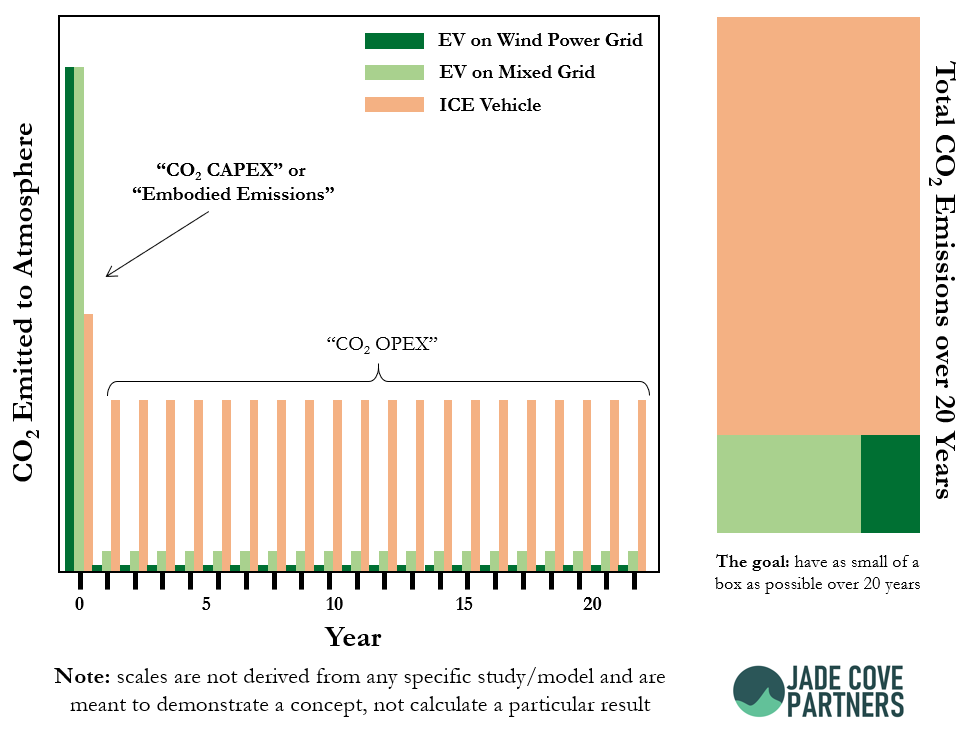
We can think of this similar to a cash flow model used in finance. For both EVs and ICE vehicles, CO2 is emitted in manufacturing (i.e. CO2 capital expense, or CAPEX) and through power consumption over the life of the vehicle (i.e. CO2 operating expense, or OPEX). This is one reason why Tesla is focused on a “million-mile battery”: the ratio of size of the red box to green boxes below is larger the longer the battery lasts, leading to deeper decarbonization.
Embodied Emissions: The Final Frontier of Deep Decarbonization
When EVs use electricity derived from wind, solar, geothermal, nuclear, and hydro power plants built from decarbonized steel, (3) aluminum, (4) and concrete, (5) the carbon emissions from driving an EV become even lower. At that point, deeply decarbonized power (ultra-low “CO2 OPEX” for EVs) makes it so that the EV’s entire CO2 footprint is in its embodied emissions (its “CO2 CAPEX”). Technological solutions to decarbonize the power grid are mature and major banks know how to finance solar and wind power plants because they’ve already been doing it for decades. The lithium, nickel, cobalt, and other materials that make up the EV’s battery all carry a carbon footprint for mining, processing, and cathode material manufacturing, and there are now people working on decarbonizing those supply chains. Decarbonizing the manufacturing of the battery and the production of the materials that make up the battery are the final frontier of deep decarbonization.
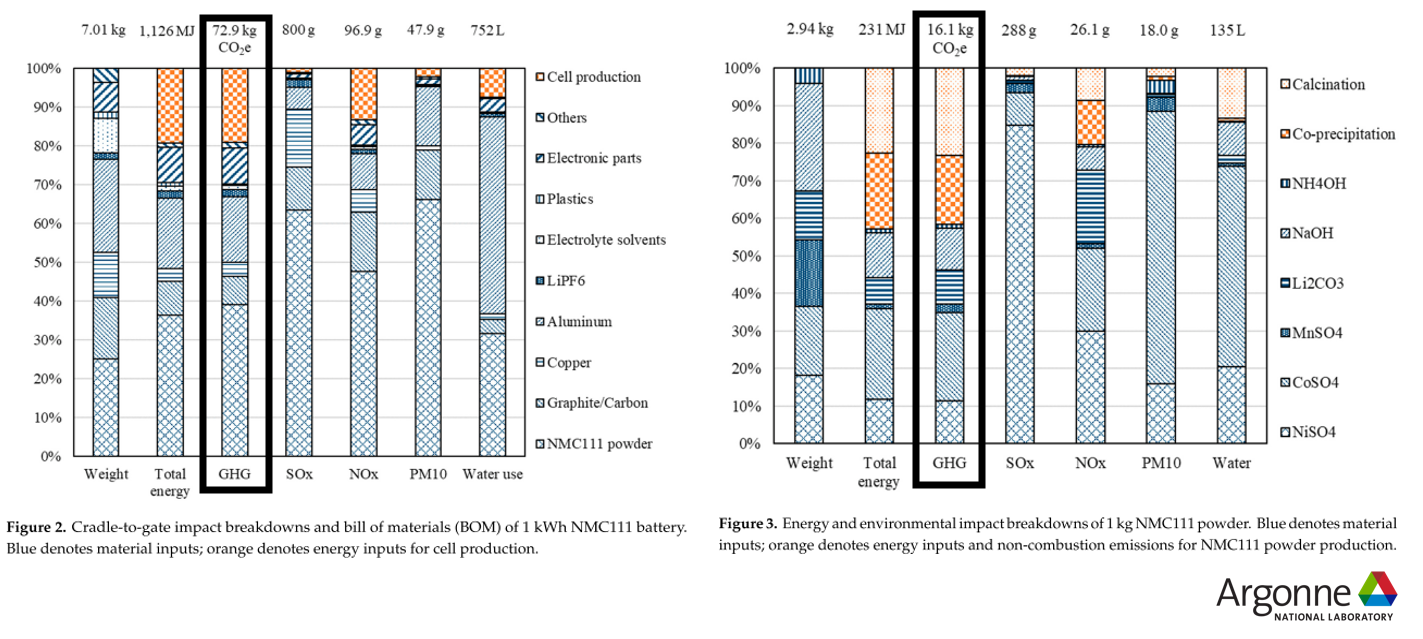
This challenge cannot be solved without being quantified. The CO2 impact of manufacturing LIBs has been studied since LIBs started becoming popular in the 2010s. Argonne National Laboratory published their first life cycle assessment (LCA) on the topic in 2012, and updated their results in 2019. Below is a breakdown of the environmental impacts of producing 1 kWh of an LIB, with CO2 intensity in a black box (figure on the left). (6)
Manufacturing NMC111 powder (the cathode material) is the single highest CO2 intense step in LIB cell manufacturing. Energy is used to make the cathode material from chemical precursors including Li2CO3, NiSO4, MnSO4, and CoSO4, all of which consume energy and materials during extraction/mining and refining. The Argonne team broke down the CO2 intensity of these inputs and their findings are below with CO2 intensity in a black box (figure on the right). Lithium carbonate (Li2CO3) in this model represents around 10% of the CO2 emissions associated with making the cathode material. This puts CO2 emissions from Li2CO3 extraction/mining and refining at around 4% of the total CO2 emissions for the full battery cell in the Argonne model. It is often commented that the CO2 emissions associated with lithium in LIBs is small, and this has historically been true.
The Evolving Lithium Market and its Contribution to CO2 Emissions
LIB industry professionals will note the cathode chemistry assumed in the Argonne model. NMC111 is a low nickel cathode material made from Li2CO3. Yet, many market forecasts expect that higher nickel content cathode materials like NMC 811 or “9XXX” will become more popular in EVs in the 2020s because they have higher energy density, which is important for extending the range of EVs. (7) This is a development which requires an updated model because this cathode material uses different proportions of metals, different quantities of energy, and notably does not use Li2CO3. Instead, lithium hydroxide (LiOH٠H2O) is used to make these materials. This is a different lithium chemical, made through different manufacturing processes. Moreover, lithium hydroxide is often made from different kinds of natural resources compared to how Li2CO3 is traditionally made.
How does LiOH٠H2O affect lithium’s share of CO2 emissions in LIB manufacturing? How does the type of natural resource mined for producing LiOH٠H2O compared to conventional Li2CO3 sources affect the CO2 footprint? This is important to EV and LIB industries, not just for minimizing embodied emissions of manufacturing, but also for reducing costs (from fossil fuels). In addition, new LiOH٠H2O producers may struggle to sell into markets with mandates to reduce carbon footprints throughout the value chain (e.g. the EU). All this with the backdrop of potentially massive fines for auto manufacturers for high CO2 intensity vehicle fleets (which can be mitigated by selling electric vehicles). (8) Volkswagen is already taking this topic seriously, committing to their “gotozero” campaign for EVs. The CO2 intensity of the 2020s’ LiOH٠H2O supply chain has not been studied until now, which is different to what was considered in the Argonne LCA of supply chains in the 2010s.
From the 1990s to the 2010s, most lithium was extracted from brine resources in South America using evaporation, mainly producing Li2CO3, not LiOH٠H2O. That changed in the 2010s as the Chinese EV revolution kicked off and Tesla emerged with its compelling product offerings. Demand for EVs exploded in China in the last 10 years because of subsidies and air quality concerns in Chinese cities, and EVs are proving to be a compelling choice for consumers world-wide. This caused a 2010s Chinese-dominated “lithium rush”. Due to the complexities, and long, unpredictable lead-times of deploying evaporation pond brine projects and the (at the time) unavailability of new technologies to produce lithium from different kinds of brines, lithium companies and their customers were unable to source from South America fast enough to meet the country’s new demand.
Major lithium producers like Ganfeng, Albemarle, SQM, and Tianqi have turned to spodumene “hard rock” deposits in Australia, which are a fundamentally very different kind of lithium resource requiring very different extraction technology. Hard rock resources involve tried-and-true mechanical mining (ex. digging, explosions, crushing, etc.), high carbon intensity roasting steps, and a hydrometallurgical leaching process. Cheap coal, natural gas, and chemicals are available in China to make this process route economic in a high lithium price environment. The industry goal in the 2010s was to meet Chinese demand, not to have low CO2 intensity lithium supply. This “lithium rush” has moved the world’s lithium production center of gravity to China, where the hard rock resources predominantly come from Australia. This model is being replicated elsewhere alongside small streams of LiOH٠H2O production from brine producers made via Li2CO3. Quantifying the CO2 intensities of these LiOH٠H2O products made in China and elsewhere is important for pursuing the final frontier of deep decarbonization so we can understand which process routes emit the least CO2.
The Minviro Lithium Life Cycle Assessment (LCA)
We developed an LCA model and data structure tailored specially for the lithium industry in collaboration with Robert Pell at Minviro. Using Alex and David’s knowledge of lithium extraction processes and markets, and Robert’s deep background in LCA calculations, we developed a model that can calculate the CO2 impact of any lithium product using any extraction or refining process, operating or proposed. The quality of any LCA is dependent on the quality of the input data used like fossil fuel consumption, reagent consumption, water consumption, and other inputs, so efforts were made to collect the most dependable data available from across the lithium industry, cross-checking with impact data published by lithium companies.
The Minviro Lithium LCA uses well-established procedures and methods governed by specific rules and standards, most notably those developed by the International Organization for Standardization (ISO). The ReCiPe Midpoint Hierarchist method was applied in this LCA to translate emissions and resource extractions into a limited number of environmental impact scores.
The LiOH٠H2O Products Modeled
LiOH٠H2O is produced in different ways by different companies from different natural resources, meaning there is no single LiOH٠H2O CO2 intensity of production, but a range for different LiOH٠H2O products offered by different companies from different operations. Further, LiOH٠H2O products vary in quality (impurity content for example, which can be very battery-manufacturer specific) in a way that was not as important on a massive scale before the 2010s when it was mostly used in grease & glass. All of these things impact the CO2 intensity of production.
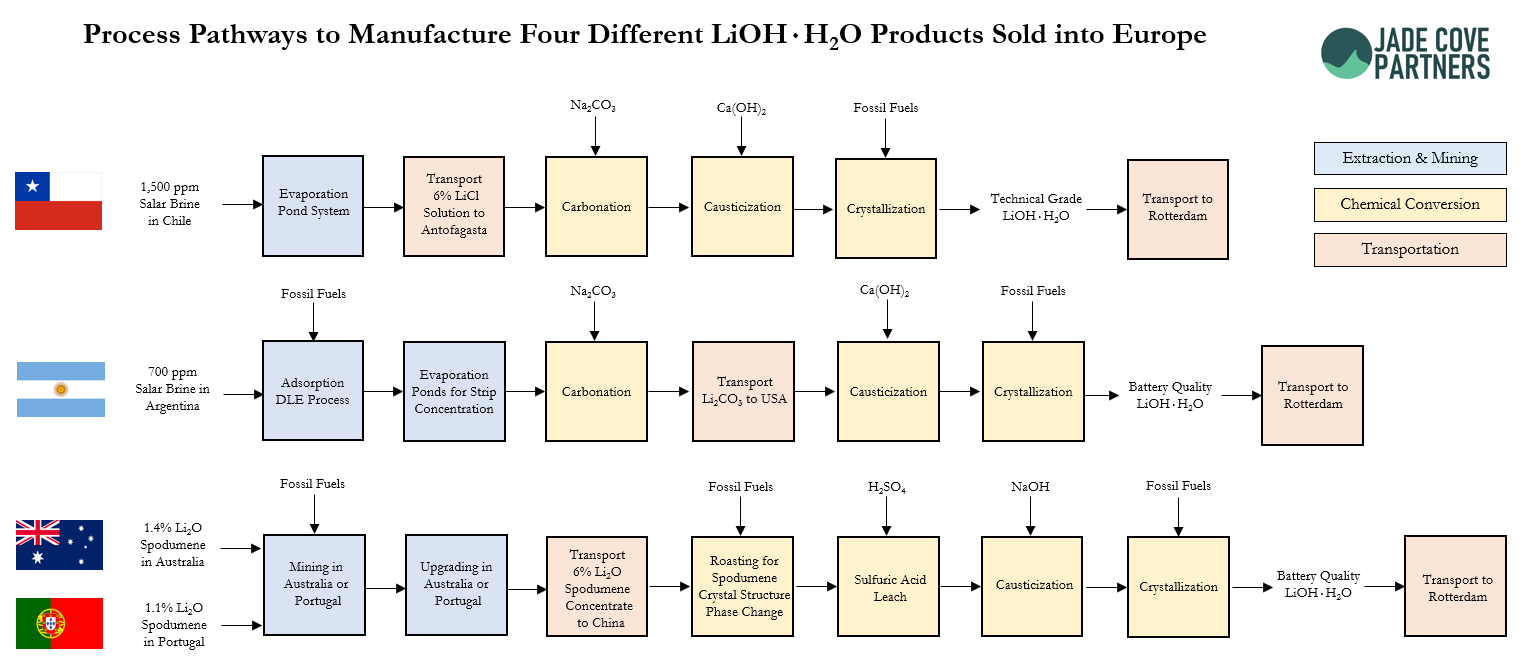
We chose the following LiOH٠H2O products to model as part of this LCA to compare the CO2 intensities of each. The majority of this information originates from published data, linked to real resources, operators, and proposed projects. In the minority of cases where there was no public data, 1st principles models were used to calculate impacts associated with mining and chemical processes.

The functional unit of the LCA is the reference for comparison between the projects. For the Minviro Lithium LCA, the functional unit is 1 tonne of LiOH٠H2O FOB Port of Rotterdam, the Netherlands (highlighting the importance of carbon intensity to the European LIB/EV market). The simplified extraction and refining flowsheets showing some of the main material and energy inputs in the model are shown below.
Results
The Argonne LCA on NMC111 cathode material assumed a carbon intensity for Li2CO3 of around 2.5 tCO2/tLi2CO3 derived from SQM process data. SQM often claims that theirs is some of the most environmentally responsible lithium product available. Given that 95% of the energy that Atacama operators consume is free solar energy to concentrate their extremely high-grade brine in their evaporation ponds, they are not wrong. (9)
This is for Li2CO3 though. LiOH٠H2O is a different product requiring extra processing steps, namely causticization and crystallization, and is processed differently from spodumene resources. The Argonne team recognized in their 2019 LCA update that the type of lithium product common for future batteries was in flux, but kept SQM’s numbers in their model because there was no other industrial data available on LiOH٠H2O products until now. Below are our estimated impacts of producing battery quality LiOH٠H2O products from different resources using different processes developed in our LCA study:
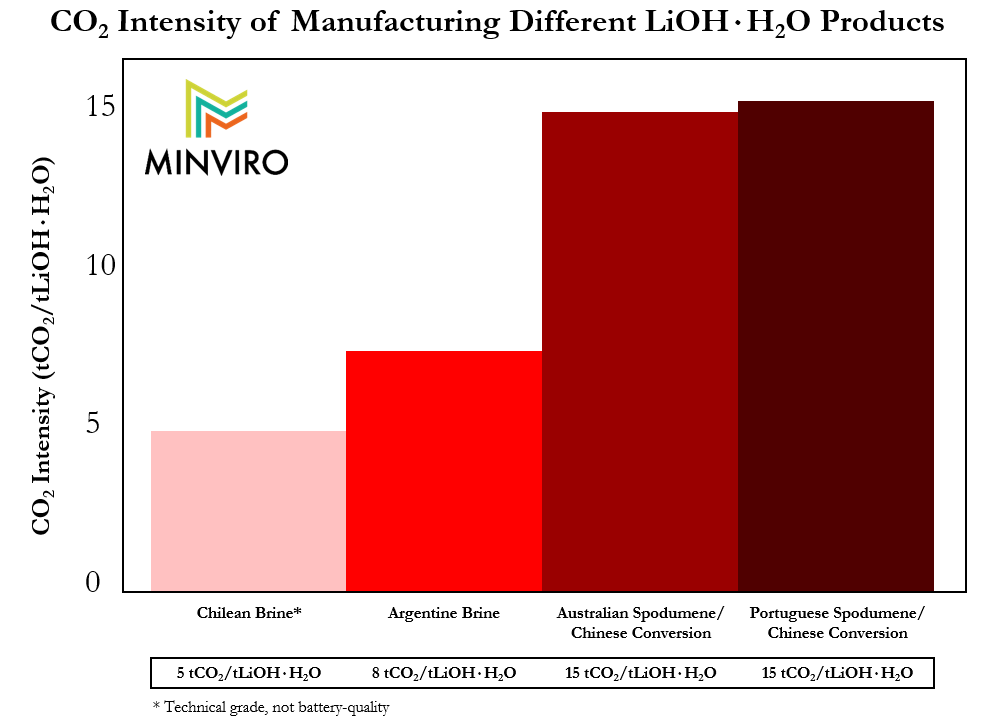
We believe some of the important takeaways from these results include:
LiOH٠H2O products made from spodumene resources are almost 7x higher CO2 intense to produce compared to historically available numbers because of the need for energy in mining, roasting of the spodumene concentrate, and chemical conversion. Whether the mining is in Australia or Portugal, the CO2 intensity is significant.
The CO2 intensity of processing spodumene concentrate in China is the highest in the world, making LiOH٠H2O products from China the most CO2 intense LiOH٠H2O products available on the bulk market. Different electricity grids will have different CO2 intensities, and the only way to be able to know for sure if a spodumene mining operation has a lower CO2 intensity is to model it using ISO-compliant LCA.
Technical grade LiOH٠H2O made from the Chilean brine operation is ~2x more CO2 intense to make than SQM’s historical Li2CO3 products because of the causticization and energy intense crystallization steps involved in making LiOH٠H2O. It would take even more energy to double crystallize the LiOH٠H2O, increasing the CO2 intensity of a battery quality LiOH٠H2O product derived from that operator’s resource even more.
LiOH٠H2O product derived from the brine operation in Argentina is more CO2 intense to make than the Chilean technical grade product because of the large quantity of natural gas used for heating the brine in their direct lithium extraction (DLE) process. Their DLE process was designed decades ago and alternative DLE technologies are in development which may not require this large quantity of heat.
Lower grade spodumene resources have a higher CO2 intensity of mining, increasing the CO2 intensity of the LiOH٠H2O products derived from that spodumene concentrate.
All of this means that the industry shift towards the use of LiOH٠H2O in cathode materials and the production of LiOH٠H2O from spodumene concentrate in China is increasing the CO2 intensity of lithium in the LIB by a significant factor, making lithium a much higher CO2 intensity ingredient of the LIB of the 2020s. If the European market and industry professionals would like to see the industry move towards the final frontier of deep decarbonization, then this is bad news.
To be clear, EVs containing LIBs made from high CO2 intensity LiOH٠H2O hopefully save significantly on CO2 emissions over the life of an EV compared to ICEs. However, just because the Australian spodumene-Chinese conversion LiOH٠H2O supply chain was developed to meet demand in a 2010s “lithium rush”, doesn’t mean that such high CO2 intensity (and high cost) approaches should be deployed further as the lithium market grows.
Conclusions & Recommendations
Unless new low CO2 intensity LiOH٠H2O products become available, lithium’s share of CO2 embodied emissions in LIBs will increase from a small 4% to a much more significant 20-30% (all else assumed equal, though other metal contents and their production methods are changing too). If the average CO2 intensity for producing lithium products is 15 tCO2/t LiOH٠H2O, and there is 500,000 tLiOH٠H2O/year of supply in 2030 at this CO2 intensity. That would be equivalent to bringing on new CO2 emissions equivalent to the 2017 CO2 emissions of the entire country of Jamaica. (10)
We believe it is important to work on decarbonizing the lithium supply chain the same way that steel, aluminum, and cement have all recently been the focus of decarbonization. This will require new technologies for lithium extraction and new ways of thinking in the lithium industry.
We believe that some of the best opportunities to decarbonize the LiOH٠H2O supply chain include operations which produce zero carbon energy and LiOH٠H2O simultaneously. These include:
Combined geothermal-lithium projects that use advanced direct lithium extraction (DLE) technologies paired with low CO2 intense power/heat from geothermal energy production. With no mining and no necessary fossil fuel inputs, these projects could actually have negative CO2 intensities when offsets of low CO2 intense power sold to the grid displace coal-fired generation. There are projects in the USA and Germany both looking to do this and they are making rapid progress.
Lithium projects that extract lithium from unconventional resources like sedimentary materials which do not require roasting, but do require H2SO4. Sulfur can be burned on site to produce H2SO4 and low CO2 intense power/heat produced to facilitate energy-intense lithium processing similar to the geothermal-lithium case.
Some other ideas that could be incorporated into more conventional or operating projects include:
Use of low CO2 intense power like wind, solar, geothermal, nuclear, and hydroelectric in both mining and chemical conversion operations. In some places it may be possible to buy and use this power directly.
Use of low energy intense technologies for lithium extraction, mining, and chemical conversions.
Institutional investors, especially those in Europe, should fund new lithium projects which may be able to produce veritably (quantified) low carbon intensity LiOH٠H2O products.
Only ISO-certified LCAs should be used when communicating the environmental footprint of lithium products. We encourage the Argonne team and other academic groups to conduct similar studies and to help refine these results. We will publish more on the topic in the future, and invite interested parties to reach out to discuss this study.
P.S. A Note on Greenwashing
We are excited for the future of the lithium industry because of its potential to help decarbonize transportation and mitigate catastrophic climate change. However, we have observed some aspiring spodumene mining projects have claimed to have “green lithium” products. This marketing is deceptive for three reasons:
1. These projects have not backed up the “green” claim with veritable, quantifiable ISO-compliant LCAs.
2. These projects do not make end-use lithium products, they make spodumene concentrate, unless they build chemical plants to make LiOH٠H2O.
3. Conventional approaches for LiOH٠H2O production from spodumene are unable to produce low CO2 intense LiOH٠H2O because of the intrinsic nature of the lithium resource, and the required use of fossil fuels as energy input. Alternative approaches, and CO2-free energy inputs are needed to decarbonize production.
We encourage aspiring lithium projects to avoid greenwashing tactics, and instead work toward deploying low-CO2, low-cost routes to market. Thankfully there is a way to determine if LiOH٠H2O products are “green” or not. All aspiring and producing lithium extraction projects should procure an ISO-compliant LCA, and benchmark themselves transparently on quantifiable measures of being “green”. Based on our review of the industry, we believe that a truly “green” LiOH٠H2O product should have a quantified CO2 intensity of less than 5 tCO2/tLiOH٠H2O. Some of the other impact categories analyzed in LCA studies include:
1. Freshwater Depletion (tH2O/tLiOH٠H2O)
2. Particulate Matter (kgPM2.5eq./tLiOH٠H2O)
3. Human Toxicity (kg1,4-DCB/tLiOH٠H2O)
4. Land Occupation (acres/(tLiOH٠H2O/year))
We are available to discuss details of the breakdown of CO2 intensity of the LiOH٠H2O products modeled in this study and results for other impact categories with interested parties.
Acknowledgements
We’d like to thank Vulcan Energy Resources Ltd. and EnergySource Minerals LLC for co-sponsoring this study. Both sponsoring companies had no influence on the process or results of the LCA analysis. Thank you to Erik Emilsson of the Swedish Environmental Research Institute for reviewing this report. Thank you to Pedro Mauricio Torres of Beyond Lithium Consultores for helpful information on South American brine operations.
References
This study follows the standards as described by ISO14040:2006 Principles and frameworks of LCA, and ISO14044:2016: Requirements and guidelines for LCA standards. The LCA study modeled Scope 3 emissions.
(1) Union of Concerned Scientists, 2017. New Numbers Are In and EVs Are Cleaner Than Ever. URL.
(2) VW ID Insights Sustainable E-Mobility Presentation.
(3) Gillis, 2019. The Steel Mill That Helped Build the American West Goes Green. URL.
(4) Apple, 2018. Apple paves the way for breakthrough carbon-free aluminum smelting method. URL.
(5) ClimateWorks Foundation, 2019. Deep Decarbonization: A Roadmap for the California Cement and Concrete Industries. URL.
(6) Dai, 2016. Life Cycle Analysis of Lithium-Ion Batteries for Automotive Applications. URL.
(7) Greentech Media, 2019. How the Battery Sector Is Looking to Improve Lithium-Ion. URL.
(8) Financial Times, 2019. Europe car groups face huge profit hit to cut CO2. URL.
(9) SQM, 2019. 2018 Sustainability Report. URL.
(10) Wikipedia, 2020. List of Countries by Carbon Dioxide Emissions. URL.